Pages dedicated to verifying Mathelitics tutorials
Technique to determine best exponent to use when predicting a minimum error deviation from the predicted run equation for each team over 5 seasons
1. Get team runs and runs allowed
2. Compute actual win/lose percentage.
3. Compute predicted win/lose percentage using formula run^exp/(ra^exponent + 1)
4. Compute column of absolute difference subtracting actual from predicted.
5. If you want more information you can just subtract w/o abs difference and get lucky and unlucky teams
6. Set up an input cell for the average of all abs of difference column.
7. Make sure you have an exponent cell. It should be in the range of the column of trial exp's that you set up next.
8. Set up a column of trial exponents
9. Now set your MAD cell to =average(difference) or in this case below =k2
10. Next select column starting at M6 and N6 thru the try exponent list
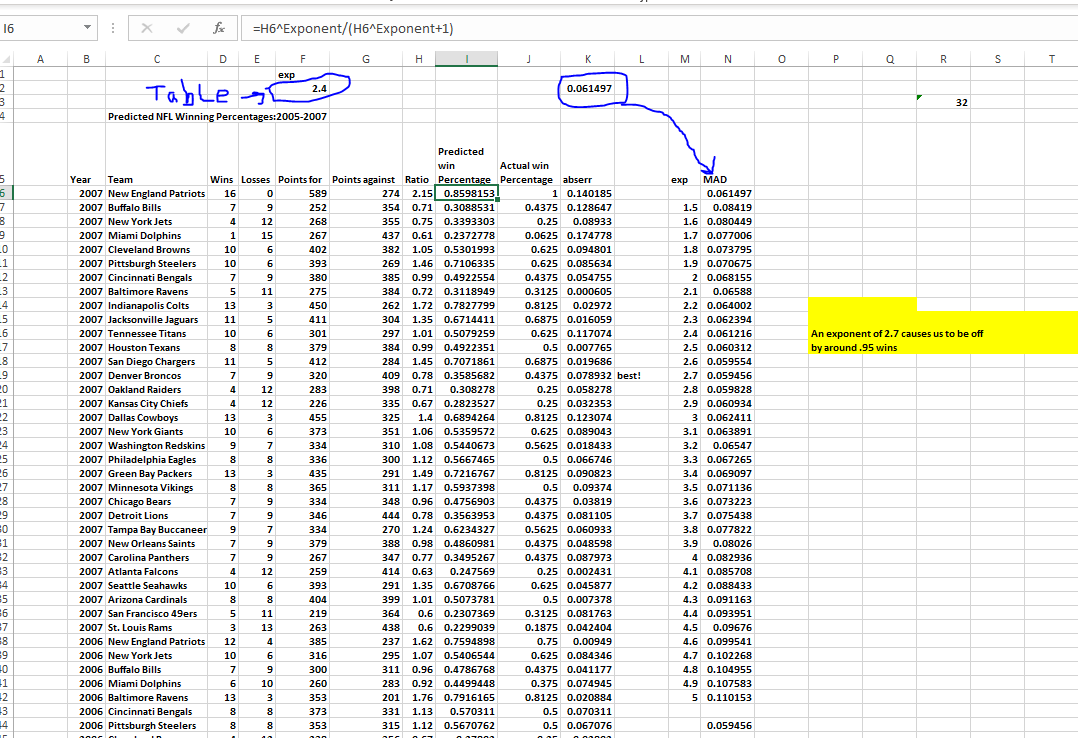
Date--->What if analysis--->Table and since you are dealing with a columns--> set the column input for the one way data table with the exponent cell that is tied to the run^exp/(ra^exp + 1) exponent and hit ok.
This is how I think this works and why it is so confusing to follow. There is a lot going in the background. The table is iterating through the exponents on the predicted win column and then and then revaluating the abserr column for a new average with each exponent. Then it is returning an average for each of those set of results. To determine the best exponent look for the smallest absolute difference and then you have from an average the best exponent that proves the best result. See yellow highlight in excel spread sheet.
The exponent column updates the run equation, then the average function list the average from the abserr list and inputs it next to the "try" exponent. The key is using that exponent to start the iteration through the average formulan in the column next to the exponents. So all you doing in autofilling the update average formula for each step in the exponent. That is fullfilling the table.
We found that the
Pythagorean approach correctly predicted 57 of 106 playoff
series (53.8%) while the “games won” approach correctly
predicted the winner of only 50% (50 out of 100) of playoff
series.³ The reader is probably disappointed that even the
Pythagorean method only correctly forecasts the outcome ofof less than
54% of baseball playoff series. I believe that the regular season is a
relatively poor predictor of the playoffs in baseball
because a team's regular season record depends
greatly on the performance of five starting pitchers.
During the playoffs teams only use three or four
starting pitchers, so much of the regular season
data (games involving the fourth and fifth starting
pitchers) are not relevant for predicting the out-
come of the playoffs.
The 2019 World Series certainly follows this reasoning with Stephen Strasbury, Patrick Corbin and Max Scherzer having such a good postseason and series. The Nationals: Pythagorean W-L: 95-67, 873 Runs, 724 Runs Allowed and Houston: Pythagorean W-L: 107-55, 920 Runs, 640 Runs Allowed
It appears that the playoffs stress a teams stucture differently so that teams with the best 3 top pitchers fair better??
Pythagorean: Luck and not so Lucky
The deviation from luck and not lucky can be used to predict reversals and the author gives examples of these during the playoffs.
Author takes two players and describes their typical statistics which would leave the analayst with the impression that the player with the better general stat like BA predicts [runs created]
1979 runs created Bill James contribution:
It measures how good things and bad things effect runs created
TB = Singles + 2*Doubles(2B) + 3 * Triples(3B) + 4 * Home Rus (HR)
Conclusion we after season long statistics that we can equate runs scored.
Right question: How does each additional base contribute to runs created. Can you develop a formula that predicts runs from bases + HBP + BB and Outs
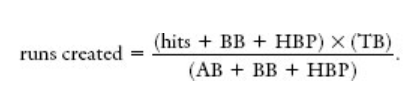
I think the author does a good job of analayzing the equation by taking it apart over the common denominator
hits + BB + HBP/(AB + BB + HBP), TB/(AB + BB + HBP)
Very poor or very good players can skew these results.
One of the first ideas taught in business statis-
tics class is the following: do not use a relationship that is fit to a data set to
make predictions for data that are very different from the data used to fit the
relationship. Following this logic, we should not expect a Runs Created For-
mula based on team data to accurately predict the runs created by a super-
star such as Barry Bonds or by a very poor player.
Comparing Bonds, Ichiro and Nomar
(Hits + HBP + BB) times (Total Bases)/ AB + BB + HBP
Page 37
Chapter One
Terms
Chapter One Appendix Lab
Chapter Two "runs created approach"